Open Telemetry
NOTE
all traces, metrics and logs include labels for extra meta-data
Telemetry is fully supported to help debug what is going on
Metrics
NOTE
In preview
Metrics are there to help develop dashbaords, and you can use them to see what is going on inside laters
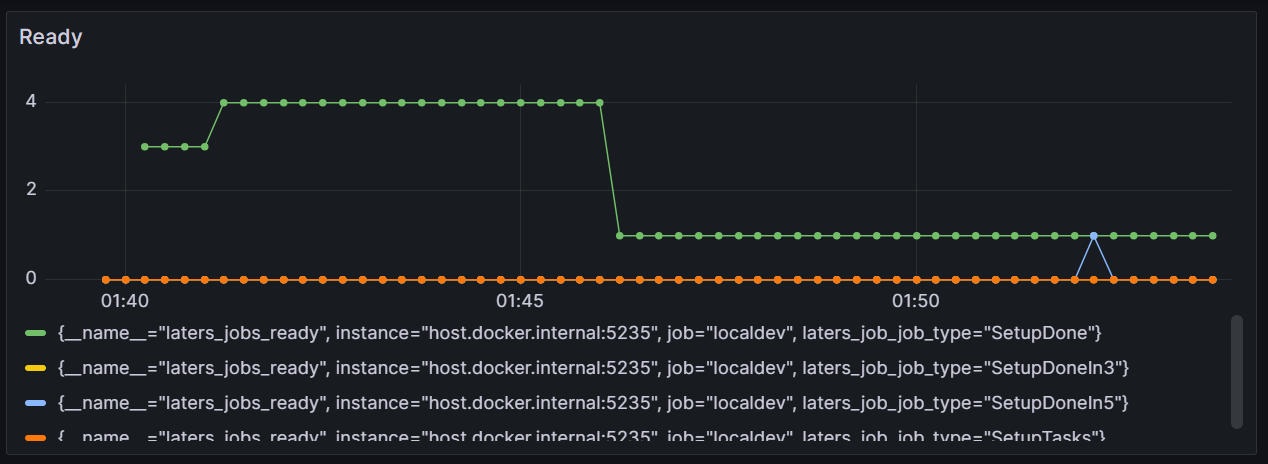
There are a few metrics collected inside the laters library
| metric | type | Use |
|---|---|---|
| laters.jobs.enqueue | counter | when a job is enqueued |
| laters.jobs.process | counter | when a job is processed |
| laters.jobs.process.errors | counter | when a job is processed with errors |
| laters.jobs.ready | gauge | number of jobs that are ready to be processed |
| laters.jobs.scheduled | gauge | number of jobs that are scheduled to be processed |
| laters.jobs.deadletter | gauge | number of jobs that are deadlettered |
| laters.process_time | histogram | time to process the message |
Code
Collect Metrics using the OpenTelemetry library, and export them via Prometheus
- 1️⃣ - Add OpenTelemetry to your services
- 2️⃣ - Add
latersmetrics - 3️⃣ - Add other metrics
var serviceName = "todoApp"; //name of your service

builder.Services.AddOpenTelemetry() // 1️⃣
    .WithMetrics(b =>
    {
        b.ConfigureResource(r => r.AddService(serviceName))
            .AddLatersInstrumentation() // 2️⃣

            // 3️⃣
            .AddProcessInstrumentation()
            .AddAspNetCoreInstrumentation()

            .AddPrometheusExporter();
    })
Traces
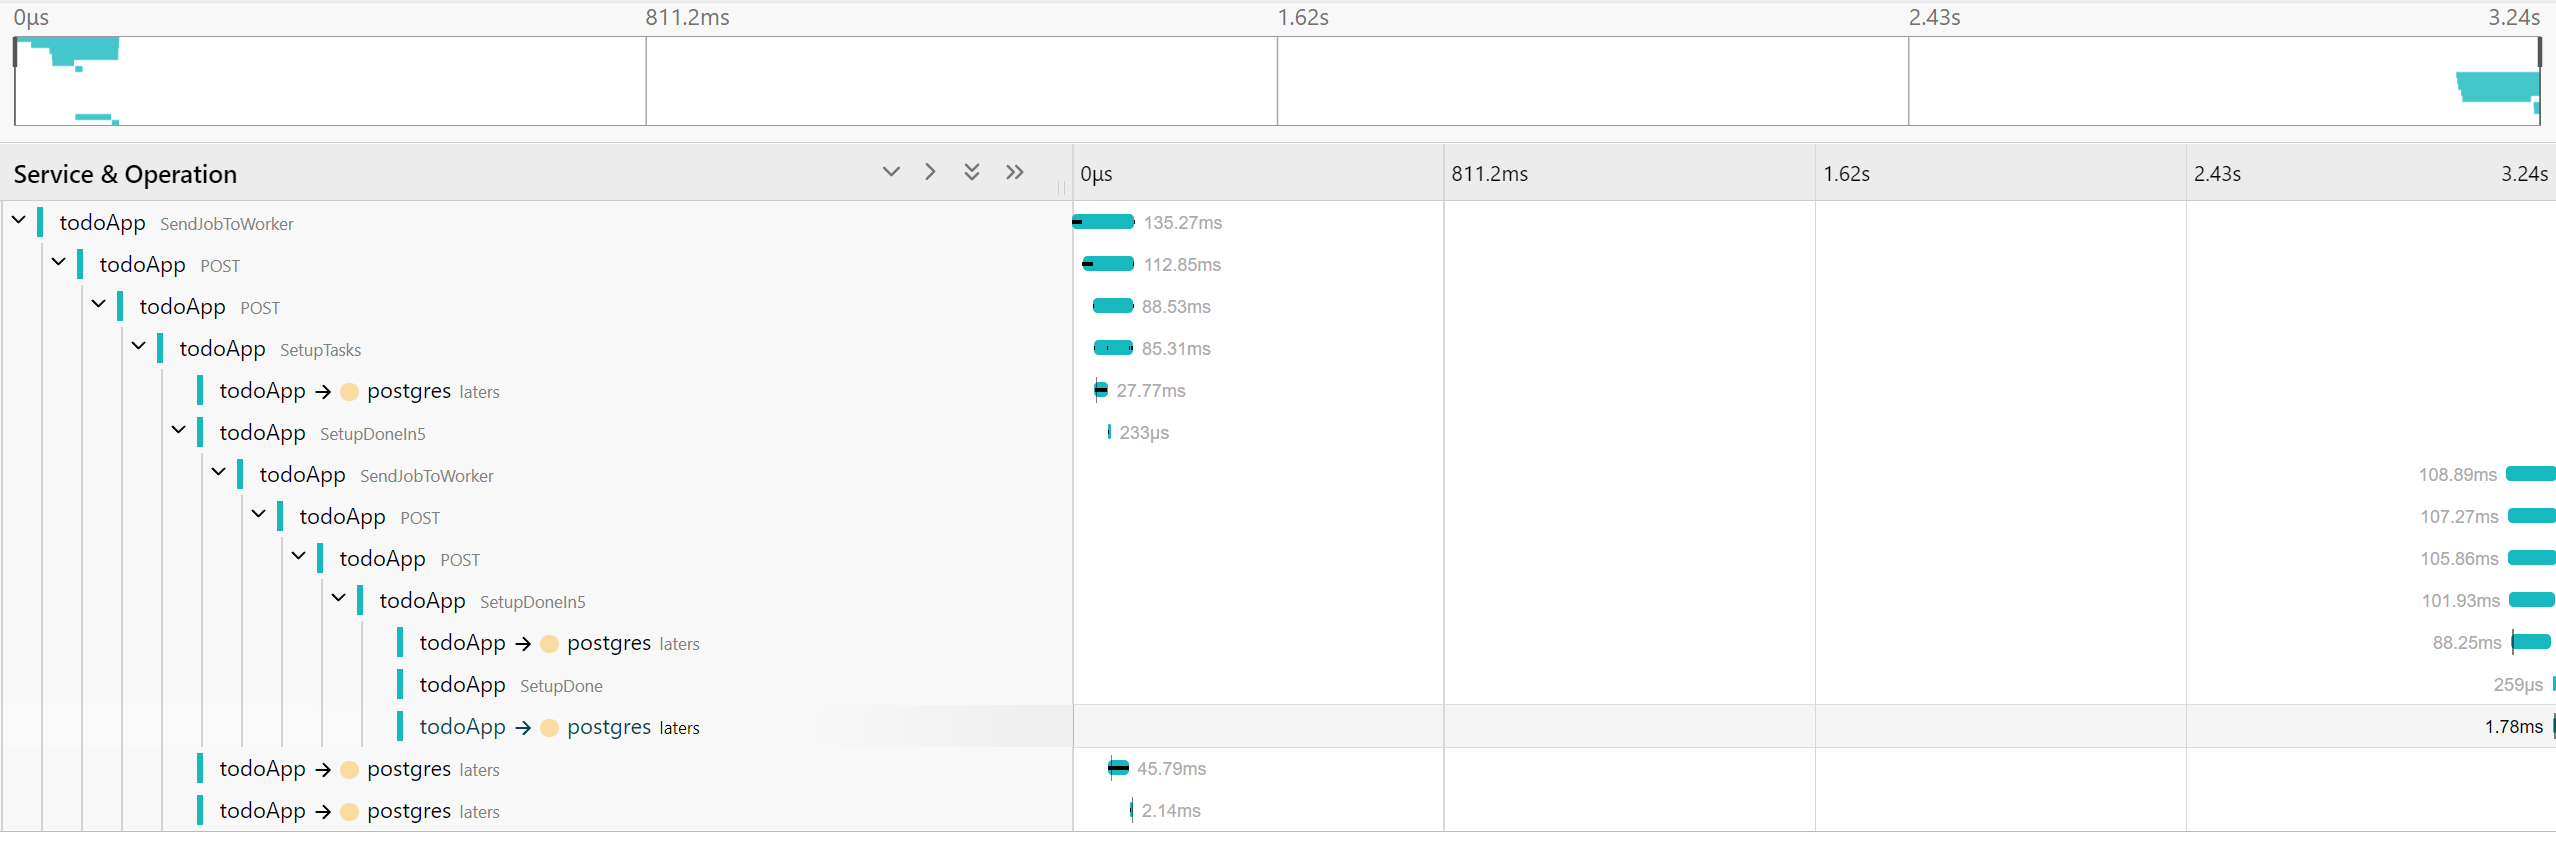
As jobs are linked with other actions and other jobs, traces are supported to visualize this.
context
When a job is enqueued/created and when it is eventually processed, you will see the trace for both these actions
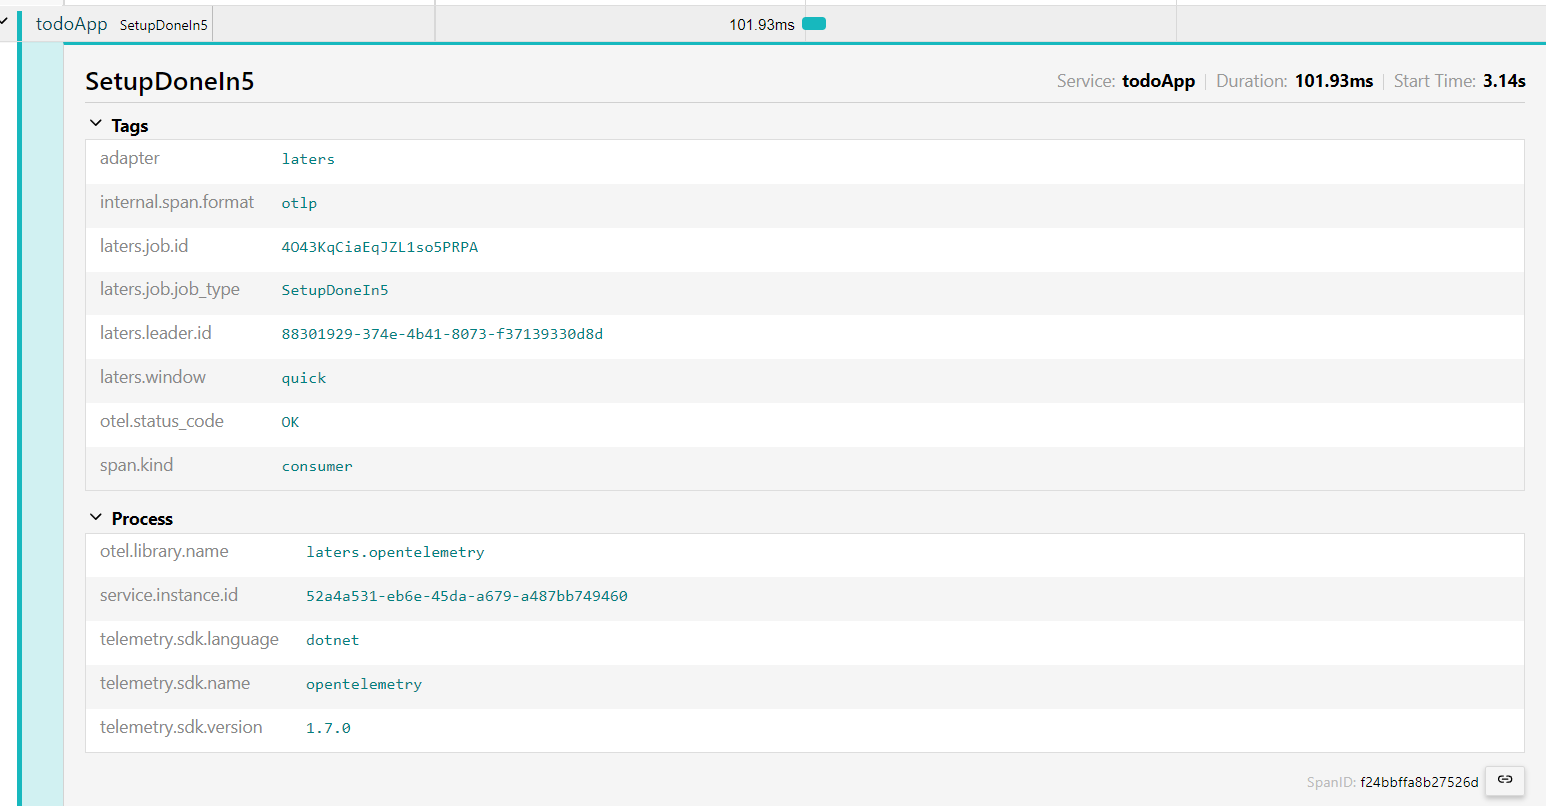
| action | span.kind | Use |
|---|---|---|
| ForLater | producer | when a job is enqueued |
| Handler | consumer | when a job is processed |
here is an example of the consumer (a job being processed)
Code
This example uses OpenTelemtry Tracing along with its associated exporter.
- 1️⃣ - Add OpenTelemetry to your services
- 2️⃣ - Add
laterstracing - 3️⃣ - Add other tracing
var serviceName = "todoApp"; //name of your service

builder.Services.AddOpenTelemetry() // 1️⃣
    .WithTracing(b =>
    {
        b.ConfigureResource(r => r.AddService(serviceName))

            .AddLatersInstrumentation() // 2️⃣

            // 3️⃣
            .AddAspNetCoreInstrumentation()
            .AddNpgsql()
            .AddHttpClientInstrumentation()

            .AddOtlpExporter(opts =>
            {
                opts.Endpoint = new Uri("http://otel-collector:4317");
            });
    });
Logs
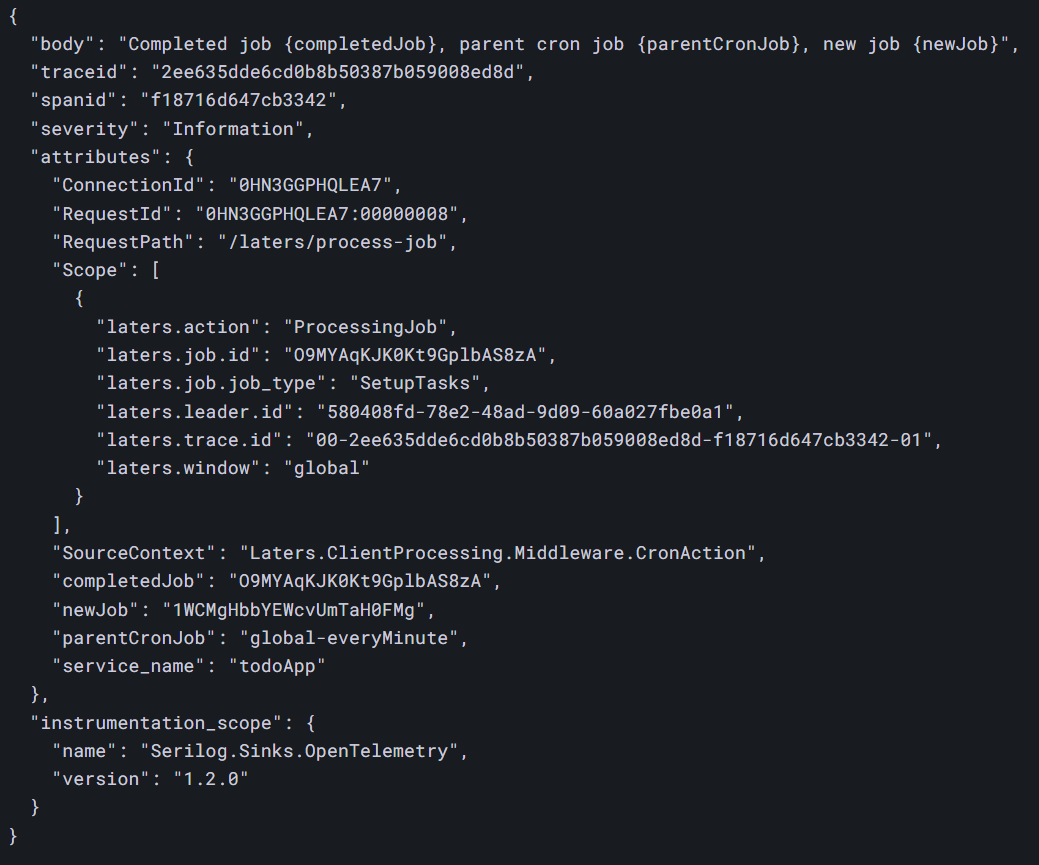
For detailed output of information, laters supports logging (with no Personal Information being captured by the core library)
NOTE
logs and traces share trace-id so you can correlate them.
Code
The example shows how to setup logging using the Serilog library, along with exporting the logs via OpenTelemetry
- 1️⃣ - Add Serilog
- 2️⃣ - Optionally export logs to the console (stdout)
var serviceName = "todoApp"; //name of your service

// 1️⃣
builder.Host.UseSerilog((context, config) =>
{
    config
        .Enrich.FromLogContext()
        .Enrich.With(new PropertyEnricher("service_name", serviceName))
        //.Filter.ByIncludingOnly(Matching.FromSource("Laters"))
        .WriteTo.OpenTelemetry(opt =>
        {
            opt.Endpoint = "http://otel-collector:4317";

            opt.IncludedData = IncludedData.SpanIdField |
                                IncludedData.TraceIdField |
                                IncludedData.TemplateBody;
        })
        .WriteTo.Console() // 2️⃣
        .MinimumLevel.Information();
});